Manually Crashing the Windows during hangs

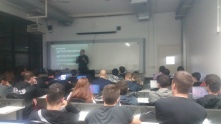
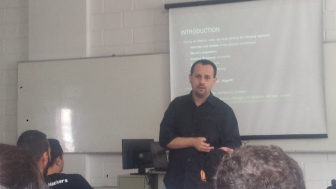
Hello readers, how are you? Two days ago, I experienced a known situation: during a presentation about malware analysis, the malware caused a hang of my system (Win7 x86) for few minutes. Of course, as I was using a virtual machine (VMware), I could have suspended the environment and analyzed the .vmem file. However, I forced (through Windows) generating a manual crash dump for analyzing it using WinDbg (very convenient to me because I was handling a kernel malware) later.

Many attendees asked how I was able to force this dump, so I decided to write a quick explanation for helping who needs this information. Of course, it is a very simple article.

It follows the link for the PDF document:

Click to access manuallycrashingwindows.pdf

I would like to make one aspect clear: I usually share tons of information through LinkedIn, Twitter and eventually on this blog for helping people. It does not give me fame, money or anything else. It makes me feeling well for helping people. Therefore, if this article help you, say a “thank you”. Certainly, I will be very glad for it.

Finally, soon I will be publishing another very simple document (about 60 pages) introducing few aspects about the analysis and unpacking a ransomware. Stay tuned!

Have a nice day.

Alexandre Borges

(LinkedIn: http://www.linkedin.com/in/aleborges and Twitter: @ale_sp_brazil).

Lecture “Analyzing Malicious Documents” at Mackenzie University 2017

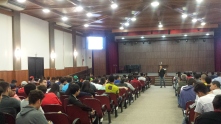
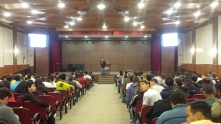
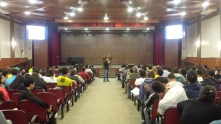
Dear readers, how are you? Only for recording, few photos about the lecture “Analyzing Malicious Documents” that I taught at Mackenzie University in MAY/22/2017 follow below:

I hope you have a nice day.

Alexandre Borges

(LinkedIn: http://www.linkedin.com/in/aleborges and Twitter: @ale_sp_brazil)

BSIDES 2017 Sao Paulo – Introduction to few anti-forensics and unpacking techniques

Dear readers, how are you? The BSIDES 2017 Sao Paulo was outstanding and I am very glad for having talked there.

Here are few photos:

Finally, the slides follow below:

Introduction to few anti-forensics and unpacking techniques:  https://alexandreborgesbrazil.files.wordpress.com/2017/05/bsides_2017_b_version.pdf

Please, share my slides for helping other security professionals.

I wish you have a nice day.

Alexandre Borges

(LinkedIn: http://www.linkedin.com/in/aleborges and twitter: @ale_sp_brazil)

Lecture: Introduction to Windows Exploit Development at Unimonte University 2017

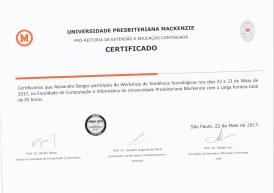
Dear readers, how are you? Two weeks ago I taught an introductory lecture about Windows Exploit Development at Unimonte University. Photos and certificate follow:

It was a great lecture because I could perform a step-by-step development of a simple exploit, which students made excellent questions.

I would like to thank you the professor Nina and Marco Simões for the kind invitation for teaching this lecture at UniMonte University.

Have a nice day.

Alexandre Borges

(Linkedin: http://www.linkedin.com/in/aleborges and Twitter: @ale_sp_brazil)

WinDbg: trivial examining of the stack

revision: 1
author: Alexandre Borges

PDF: https://alexandreborgesbrazil.files.wordpress.com/2017/04/windbg_stack_1.pdf

Hello readers, how are you? It has passed a long time since my last post. As I’ve explained previously, my time for writing is almost zero and it is very hard to write something.

Anyway, this is a quick post about WinDbg and stack’s dynamic. During my lectures about malware analysis, I am not usually concerned with my audience because most professionals are from security area and malware analysts, so technical explanations should be piece of cake.

Nevertheless, two days ago, I was surprised during a presentation about a malware where I was using WinDbg and showing stack details. Everything was going well until I have made a simple question about arguments of a function and for my surprise I realized that nobody was able to manage the interpretation of the WinDbg’s output.

To help everyone, I have decided to write this simple post. Probably, you already know about it, but just in case you also have minor questions, so eventually the subject worth to be revised.

Please, pay attention: colors are important throughout this article!

Trying to be straight, I have written a simple (and not optimized) C program (named debug3.c) without any frills and compiled it using lcc compiler (https://www.cs.virginia.edu/~lcc-win32/) on a Win x86 environment. I could have used a Win x64 system, but I would have to explain other details, which they would make the explanation a bit more complicated in this time.

It follows a trivial program and, as you will see, it has very strange parts because I tried to make odd decisions preparing the path for next articles. Some variables were declared, but they were not used because this kind of explanation is not our purpose for while:

#include
int function2(s,t,u) 
{
int e;
char *myarray2[50]=”\n\nThis is the function2.”;
printf(*myarray2);
printf(“\n\nValues of arguments are: %d %d %d”, s, t, u);
printf(“\n\nEnter a letter to return to function 1: “);
scanf(“%e”, &e);
return 0;
}

int function1(a,b,c) 
{
int f;
int m=4;
int n=5;
int o=6;
char *myarray1[50]=”\n\nThis is the function1.”;
printf(*myarray1);
printf(“\n\nValues of arguments are: %d %d %d”, a, b, c);
function2(m,n,o);
fflush(stdin);
printf(“\n\nEnter a letter to return to function main: “);
scanf(“%f”, &f);
return 0;
}

int main() 
{
int d;
int x=1;
int y=2;
int z=3;
char *myarray0[50]=”\n\nThis is the main function.”;
printf(*myarray0);
function1(x, y, z);
fflush(stdin);
printf(“\n\nWe returned to function main. Enter a letter to return to finish: “);
scanf(“%d”, &d);
return 0;
}

Compiling this program by using lcc (believe me, it is easy) results in a program named debug3.exe.

As you should know, when we list a function in assembly language, it normally has a prologue (unless it is a naked function) as shown below:

004012d4 55                        push    ebp
004012d5 89e5                    mov     ebp,esp
004012d7 81eccc000000    sub     esp,0CCh  // saving space for local variables.

Based on previous concepts, we know few facts about these three instructions:

a. At first instruction, it is pushing the EBP (saved frame buffer) for using later after returning from this current function.
b. At second instruction, it is making the current ESP as the new EBP.
c. The content of the EBP takes us to the previous EBP. Thus, we could follow backward until the start of the debugger’s calling.
d. The return pointer (RET) to previous function is equal to EBP + 4. (RET = EBP + 4).
e. The first argument used by the current function starts in EBP + 8 (start of arguments = EBP + 8).
f. Function parameters are given by EBP + value.
g. Local variables of functions are given by EBP –  value .
h. Windows usually does not allocate the whole stack at first time, but it does it on demand.
i. The TEB (Thread Environment Block) is given by FS:[0].

Once WinDbg is configured (I really hope you know how to do it), execute:

0:000> .restart
CommandLine: C:\lcc\projects\debug3\lcc\debug3.exe
Symbol search path is: srv*c:\Symbols*http://msdl.microsoft.com/download/symbols
Executable search path is:
ModLoad: 00400000 0040d000 c:\lcc\projects\debug3\lcc\debug3.exe
ModLoad: 7c900000 7c9af000 ntdll.dll
ModLoad: 7c800000 7c8f6000 C:\WINDOWS\system32\kernel32.dll
ModLoad: 7e410000 7e4a1000 C:\WINDOWS\system32\USER32.DLL
ModLoad: 77f10000 77f59000 C:\WINDOWS\system32\GDI32.dll
ModLoad: 73d90000 73db7000 C:\WINDOWS\system32\CRTDLL.DLL
(a20.8a4): Break instruction exception – code 80000003 (first chance)
eax=00241eb4 ebx=7ffde000 ecx=00000005 edx=00000020 esi=00241f48 edi=00241eb4
eip=7c90120e esp=0012fb20 ebp=0012fc94 iopl=0 nv up ei pl nz na po nc
cs=001b ss=0023 ds=0023 es=0023 fs=003b gs=0000 efl=00000202
ntdll!DbgBreakPoint:
7c90120e cc int 3

List the current breakpoints by executing the following command:

0:000> bl

Of course, we do not have breakpoints yet. So, it would be nice to create few ones right at each call (main, function1 and function2), which they will be kept even after restarting the WinDbg. Thus, instead of using the “bp” command, let’s use “bu” command:

0:000> bu debug3!main
0:000> bu debug3!function1
0:000> bu debug3!function2

Listing the breakpoints again, we have:

0:000> bl
0 e 004013fe 0001 (0001) 0:**** debug3!main
1 e 0040134f 0001 (0001) 0:**** debug3!function1
2 e 004012d4 0001 (0001) 0:**** debug3!function2

If you make a mistake, so you should remember that bp breakpointID (for example, bp 2) deletes the specified breakpoint.

Run the program until it hit the third breakpoint at function2 call:

0:000> g
Breakpoint 0 hit
eax=0040b030 ebx=7ffde000 ecx=00409058 edx=00000000 esi=00bcf754 edi=00bcf6ee
eip=004013fe esp=0012ff74 ebp=0012ffc0 iopl=0 nv up ei pl zr na pe nc
cs=001b ss=0023 ds=0023 es=0023 fs=003b gs=0000 efl=00000246
debug3!main:
004013fe 55 push ebp

0:000> g
Breakpoint 1 hit
eax=0000001c ebx=7ffde000 ecx=7c810ea6 edx=0040b340 esi=0040b2f8 edi=0012ff64
eip=0040134f esp=0012fe80 ebp=0012ff70 iopl=0 nv up ei pl nz ac pe nc
cs=001b ss=0023 ds=0023 es=0023 fs=003b gs=0000 efl=00000216
debug3!function1:
0040134f 55 push ebp

0:000> g
Breakpoint 2 hit
eax=00000020 ebx=7ffde000 ecx=7c810ea6 edx=0040b3d5 esi=0040b230 edi=0012fe70
eip=004012d4 esp=0012fd8c ebp=0012fe7c iopl=0 nv up ei pl nz na pe nc
cs=001b ss=0023 ds=0023 es=0023 fs=003b gs=0000 efl=00000206
debug3!function2:
004012d4 55 push ebp

As at this point the function2 did not create its respective stack frame (see the last instruction in brown above), so execute more a couple of instructions as follow:

0:000> p
eax=00000020 ebx=7ffde000 ecx=7c810ea6 edx=0040b3d5 esi=0040b230 edi=0012fe70
eip=004012d5 esp=0012fd88 ebp=0012fe7c iopl=0 nv up ei pl nz na pe nc
cs=001b ss=0023 ds=0023 es=0023 fs=003b gs=0000 efl=00000206
debug3!function2+0x1:
004012d5 89e5 mov ebp,esp

0:000> p
eax=00000020 ebx=7ffde000 ecx=7c810ea6 edx=0040b3d5 esi=0040b230 edi=0012fe70
eip=004012d7 esp=0012fd88 ebp=0012fd88 iopl=0 nv up ei pl nz na pe nc
cs=001b ss=0023 ds=0023 es=0023 fs=003b gs=0000 efl=00000206
debug3!function2+0x3:
004012d7 81eccc000000 sub esp,0CCh

Now, check the stack by executing the following command:

0:000> kb
ChildEBP RetAddr   Args to Child
0012fd88 004013c3  00000004 00000005 00000006 debug3!function2+0x3
0012fe7c 0040145c  00000001 00000002 00000003 debug3!function1+0x74
0012ff70 004012bc  00000001 00144380 001437e8 debug3!main+0x5e
0012ffc0 7c817067  00bcf6ee 00bcf754 7ffde000 debug3+0x12bc
0012fff0 00000000  00401225 00000000 78746341 kernel32!BaseProcessStart+0x23

Watch the current registers by running:

0:000> r
eax=00000020 ebx=7ffde000 ecx=7c810ea6 edx=0040b3d5 esi=0040b230 edi=0012fe70
eip=004012d7 esp=0012fd88 ebp=0012fd88 iopl=0 nv up ei pl nz na pe nc
cs=001b ss=0023 ds=0023 es=0023 fs=003b gs=0000 efl=00000206
debug3!function2+0x3:
004012d7 81eccc000000 sub esp,0CCh

After we have examined the last two outputs, we know that:

  1. The current EBP is 0012fd88.
  2. IF the function2 was called using three arguments, so they are: 00000004 00000005 00000006. The first one is at function’s EBP + 8.
  3. IF the function1 was called using three arguments, so they are:  00000001 00000002 00000003. The first one is at function’s EBP + 8.
  4. IF the main function was called using three arguments, so they are: 00000001 00144380 001437e8. The first one is at function’s EBP + 8.
  5. The RET (return) pointer (EBP + 4) to function1 is: 004013c3
  6. The RET (return) pointer (EBP + 4) to main function is: 0040145c
  7. Following all EBP backward, we have (* means an address, as pointers):
    • (*0012fd88) = 0012fe7c
    • (*0012fe7c) = 0012ff70
    • (*0012ff70) = 0012ffc0
    • (*0012ffc0) =  0012fff0
    • (*0012fff0) = 00000000

Thus, the most important questions are:

  1. Is it possible to follow EBP pointer backward to the beginning?
  2. Do these functions (function1, function2 and main) have three arguments each one?

The first question can be easily answered by using DDS (Dump Dwords with Symbols) command as shown below, where L5 requires that five DWORDS are listed. Thus, for the first EBP, we have:

0:000> dds 0012fd88 L5   –> we could have used dds @ebp L5 in this case
0012fd88 0012fe7c        –> function1’s EBP
0012fd8c 004013c3 debug3!function1+0x74
0012fd90 00000004       –> possible first argument of the function2  (EBP+ 8)
0012fd94 00000005       –> possible second argument of the function2
0012fd98 00000006       –> possible third argument of the function2

Using the function1’s EBP above (in blue), we have:

0:000> dds 0012fe7c L5
0012fe7c 0012ff70       –> main’s EBP
0012fe80 0040145c debug3!main+0x5e
0012fe84 00000001      –> possible first argument of the function1  (EBP+ 8)
0012fe88 00000002      –> possible second argument of the function1
0012fe8c 00000003      –> possible third argument of the function1

Using the main’s EBP (and at same way for other calls), it is possible to reach the first debugger’s call:

0:000> dds 0012ff70 L5
0012ff70 0012ffc0      –> debug3’s EBP
0012ff74 004012bc debug3+0x12bc
0012ff78 00000001     –> possible first argument of the main function  (EBP+ 8)
0012ff7c 00144380     –> possible second argument of the main function
0012ff80 001437e8     –> possible third argument of the main function

0:000> dds 0012ffc0 L5
0012ffc0 0012fff0
0012ffc4 7c817067 kernel32!BaseProcessStart+0x23
0012ffc8 00bcf6ee     –>  possible first argument of the debug3 program (EBP+ 8)
0012ffcc 00bcf754     –>  possible second argument of the debug3 program (EBP+ 8)
0012ffd0 7ffde000     –>  possible third argument of the debug3 program (EBP+ 8)

0:000> dds 0012fff0 L5
0012fff0 00000000  –> Start of calling (there is not a previous call)
0012fff4 00000000
0012fff8 00401225 debug3+0x1225
0012fffc 00000000
00130000 78746341

Wow! We have shown that is possible to follow the EBP until the beginning (the debugger’s call). Once more, let us to remember the stack and registers:

0:000> kb
ChildEBP RetAddr   Args to Child
0012fd88 004013c3  00000004 00000005 00000006 debug3!function2+0x3
0012fe7c 0040145c  00000001 00000002 00000003 debug3!function1+0x74
0012ff70 004012bc  00000001 00144380 001437e8 debug3!main+0x5e
0012ffc0 7c817067  00bcf6ee 00bcf754 7ffde000 debug3+0x12bc
0012fff0 00000000  00401225 00000000 78746341 kernel32!BaseProcessStart+0x23

0:000> r
eax=00000020 ebx=7ffde000 ecx=7c810ea6 edx=0040b3d5 esi=0040b230 edi=0012fe70
eip=004012d7 esp=0012fd88 ebp=0012fd88 iopl=0 nv up ei pl nz na pe nc
cs=001b ss=0023 ds=0023 es=0023 fs=003b gs=0000 efl=00000206
debug3!function2+0x3:
004012d7 81eccc000000 sub esp,0CCh

Now it is time to answer the second question: how can we actually to verify how many arguments each function has?

The answer is at RET pointer! We should highlight that the return address takes the execution back to the middle of the caller function. Nevertheless, if the stack is good (more about it later), so it possible to use this information to list the entire caller function.

For example, according to the stack above, the execution is at byte 3 of the function2 (EIP + 3). Therefore, to list the whole function, we should execute:

0:000> uf 004012d7 – 0x3
debug3!function2:
004012d4 55 push ebp
004012d5 89e5 mov ebp,esp
004012d7 81eccc000000 sub esp,0CCh
004012dd b933000000 mov ecx,33h

debug3!function2+0xe:
004012e2 49 dec ecx
004012e3 c7048c5a5afaff mov dword ptr [esp+ecx*4],0FFFA5A5Ah
004012ea 75f6 jne debug3!function2+0xe (004012e2)

debug3!function2+0x18:
004012ec 56 push esi
004012ed 57 push edi
004012ee 8dbd38ffffff lea edi,[ebp-0C8h]
004012f4 8d35a0b04000 lea esi,[debug3!_internalDigitArray+0x2008 (0040b0a0)]
004012fa b9c8000000 mov ecx,0C8h
004012ff f3a4 rep movs byte ptr es:[edi],byte ptr [esi]
00401301 ffb538ffffff push dword ptr [ebp-0C8h]
00401307 e81c780000 call debug3!printf (00408b28)
0040130c 83c404 add esp,4
0040130f ff7510 push dword ptr [ebp+10h]
00401312 ff750c push dword ptr [ebp+0Ch]
00401315 ff7508 push dword ptr [ebp+8]
00401318 68d5b34000 push offset debug3!_internalDigitArray+0x233d (0040b3d5)
0040131d e806780000 call debug3!printf (00408b28)
00401322 83c410 add esp,10h
00401325 68aab34000 push offset debug3!_internalDigitArray+0x2312 (0040b3aa)
0040132a e8f9770000 call debug3!printf (00408b28)
0040132f 83c404 add esp,4
00401332 8dbd34ffffff lea edi,[ebp-0CCh]
00401338 57 push edi
00401339 68a7b34000 push offset debug3!_internalDigitArray+0x230f (0040b3a7)
0040133e e8f7440000 call debug3!scanf (0040583a)
00401343 83c408 add esp,8
00401346 b800000000 mov eax,0
0040134b 5f pop edi
0040134c 5e pop esi
0040134d c9 leave
0040134e c3 ret

It is important to highlight that we have specified the offset 0x3 for listing all instructions since the function2’s beginning. If we hadn’t done it, our listing would have shown instructions only from the byte 3 onward, as shown below:

0:000> uf function2
debug3!function2:
004012d4 55 push ebp
004012d5 89e5 mov ebp,esp
004012d7 81eccc000000 sub esp,0CCh
004012dd b933000000 mov ecx,33h

debug3!function2+0xe:
004012e2 49 dec ecx
004012e3 c7048c5a5afaff mov dword ptr [esp+ecx*4],0FFFA5A5Ah
004012ea 75f6 jne debug3!function2+0xe (004012e2)
….

Could we have used the u command? This is an essential point. The uf command disassembles the whole function since its beginning and it knows where the function ends. In the other hand, the u command also disassembles from the indicated address to onward, but it does not know where the function ends, so we have to do an educated guess.

Is the command useless? It is not at all! In this example, we are working on a perfect case where the stack is not corrupted. During crashes (for example, because buffer overflow), the stack is compromised and we do not know whether the provided address comes from a function or not. Additionally, we neither know whether is correct.

See the difficult in using the u command below:

0:000> u 004012d7 – 3
debug3!function2:
004012d4 55 push ebp
004012d5 89e5 mov ebp,esp
004012d7 81eccc000000 sub esp,0CCh
004012dd b933000000 mov ecx,33h
004012e2 49 dec ecx
004012e3 c7048c5a5afaff mov dword ptr [esp+ecx*4],0FFFA5A5Ah
004012ea 75f6 jne debug3!function2+0xe (004012e2)
004012ec 56 push esi

0:000> u
debug3!function2+0x19:
004012ed 57 push edi
004012ee 8dbd38ffffff lea edi,[ebp-0C8h]
004012f4 8d35a0b04000 lea esi,[debug3!_internalDigitArray+0x2008 (0040b0a0)]
004012fa b9c8000000 mov ecx,0C8h
004012ff f3a4 rep movs byte ptr es:[edi],byte ptr [esi]
00401301 ffb538ffffff push dword ptr [ebp-0C8h]
00401307 e81c780000 call debug3!printf (00408b28)
0040130c 83c404 add esp,4

0:000> u
debug3!function2+0x3b:
0040130f ff7510 push dword ptr [ebp+10h]
00401312 ff750c push dword ptr [ebp+0Ch]
00401315 ff7508 push dword ptr [ebp+8]
00401318 68d5b34000 push offset debug3!_internalDigitArray+0x233d (0040b3d5)
0040131d e806780000 call debug3!printf (00408b28)
00401322 83c410 add esp,10h
00401325 68aab34000 push offset debug3!_internalDigitArray+0x2312 (0040b3aa)
0040132a e8f9770000 call debug3!printf (00408b28)

0:000> u
debug3!function2+0x5b:
0040132f 83c404 add esp,4
00401332 8dbd34ffffff lea edi,[ebp-0CCh]
00401338 57 push edi
00401339 68a7b34000 push offset debug3!_internalDigitArray+0x230f (0040b3a7)
0040133e e8f7440000 call debug3!scanf (0040583a)
00401343 83c408 add esp,8
00401346 b800000000 mov eax,0
0040134b 5f pop edi

0:000> u
debug3!function2+0x78:
0040134c 5e pop esi
0040134d c9 leave
0040134e c3 ret      —> End of function2
debug3!function1:
0040134f 55 push ebp
00401350 89e5 mov ebp,esp
00401352 81ecd8000000 sub esp,0D8h
00401358 b936000000 mov ecx,36h
0040135d 49 dec ecx

Have you seen what I told you? We have executed the u command five times to be able to see the whole function2, but it does not know where the function2 ends. Of course, the u command works, but if we can use uf command, so we will use it.

Repeating the previous steps above with other functions, we have:

0:000> kb
ChildEBP RetAddr   Args to Child
0012fd88 004013c3  00000004 00000005 00000006 debug3!function2+0x3
0012fe7c 0040145c  00000001 00000002 00000003 debug3!function1+0x74
0012ff70 004012bc  00000001 00144380 001437e8 debug3!main+0x5e
0012ffc0 7c817067  00bcf6ee 00bcf754 7ffde000 debug3+0x12bc
0012fff0 00000000  00401225 00000000 78746341 kernel32!BaseProcessStart+0x23

0:000> uf 004013c3 – 0x74
debug3!function1:
0040134f 55 push ebp
00401350 89e5 mov ebp,esp
00401352 81ecd8000000 sub esp,0D8h
00401358 b936000000 mov ecx,36h

debug3!function1+0xe:
0040135d 49 dec ecx
0040135e c7048c5a5afaff mov dword ptr [esp+ecx*4],0FFFA5A5Ah
00401365 75f6 jne debug3!function1+0xe (0040135d)

debug3!function1+0x18:
00401367 56 push esi
00401368 57 push edi
00401369 c745fc04000000 mov dword ptr [ebp-4],4
00401370 c745f805000000 mov dword ptr [ebp-8],5
00401377 c745f406000000 mov dword ptr [ebp-0Ch],6
0040137e 8dbd2cffffff lea edi,[ebp-0D4h]
00401384 8d3568b14000 lea esi,[debug3!_internalDigitArray+0x20d0 (0040b168)]
0040138a b9c8000000 mov ecx,0C8h
0040138f f3a4 rep movs byte ptr es:[edi],byte ptr [esi]
00401391 ffb52cffffff push dword ptr [ebp-0D4h]
00401397 e88c770000 call debug3!printf (00408b28)
0040139c 83c404 add esp,4
0040139f ff7510 push dword ptr [ebp+10h]
004013a2 ff750c push dword ptr [ebp+0Ch]
004013a5 ff7508 push dword ptr [ebp+8]
004013a8 68d5b34000 push offset debug3!_internalDigitArray+0x233d (0040b3d5)
004013ad e876770000 call debug3!printf (00408b28)
004013b2 83c410 add esp,10h
004013b5 ff75f4 push dword ptr [ebp-0Ch]
004013b8 ff75f8 push dword ptr [ebp-8]
004013bb ff75fc push dword ptr [ebp-4]
004013be e811ffffff call debug3!function2 (004012d4)
004013c3 83c40c add esp,0Ch
004013c6 ff3548c14000 push dword ptr [debug3!_translation+0x23f (0040c148)]
004013cc e8b7790000 call debug3!fprintfv+0x19a (00408d88)
004013d1 83c404 add esp,4
004013d4 6860b34000 push offset debug3!_internalDigitArray+0x22c8 (0040b360)
004013d9 e84a770000 call debug3!printf (00408b28)
004013de 83c404 add esp,4
004013e1 8dbd28ffffff lea edi,[ebp-0D8h]
004013e7 57 push edi
004013e8 685db34000 push offset debug3!_internalDigitArray+0x22c5 (0040b35d)
004013ed e848440000 call debug3!scanf (0040583a)
004013f2 83c408 add esp,8
004013f5 b800000000 mov eax,0
004013fa 5f pop edi
004013fb 5e pop esi
004013fc c9 leave
004013fd c3 ret

It is nice! We were able to list the whole function1 and we have also confirmed that the function2 was called using three arguments!

By using the same technique for other functions, we have:

0:000> kb
ChildEBP RetAddr   Args to Child
0012fd88 004013c3  00000004 00000005 00000006 debug3!function2+0x3
0012fe7c 0040145c  00000001 00000002 00000003 debug3!function1+0x74
0012ff70 004012bc  00000001 00144380 001437e8 debug3!main+0x5e
0012ffc0 7c817067  00bcf6ee 00bcf754 7ffde000 debug3+0x12bc
0012fff0 00000000  00401225 00000000 78746341 kernel32!BaseProcessStart+0x23

0:000> uf 0040145c – 0x5e
debug3!main:
004013fe 55 push ebp
004013ff 89e5 mov ebp,esp
00401401 81ecd8000000 sub esp,0D8h
00401407 b936000000 mov ecx,36h

debug3!main+0xe:
0040140c 49 dec ecx
0040140d c7048c5a5afaff mov dword ptr [esp+ecx*4],0FFFA5A5Ah
00401414 75f6 jne debug3!main+0xe (0040140c)

debug3!main+0x18:
00401416 56 push esi
00401417 57 push edi
00401418 c745fc01000000 mov dword ptr [ebp-4],1
0040141f c745f802000000 mov dword ptr [ebp-8],2
00401426 c745f403000000 mov dword ptr [ebp-0Ch],3
0040142d 8dbd2cffffff lea edi,[ebp-0D4h]
00401433 8d3530b24000 lea esi,[debug3!_internalDigitArray+0x2198 (0040b230)]
00401439 b9c8000000 mov ecx,0C8h
0040143e f3a4 rep movs byte ptr es:[edi],byte ptr [esi]
00401440 ffb52cffffff push dword ptr [ebp-0D4h]
00401446 e8dd760000 call debug3!printf (00408b28)
0040144b 83c404 add esp,4
0040144e ff75f4 push dword ptr [ebp-0Ch]
00401451 ff75f8 push dword ptr [ebp-8]
00401454 ff75fc push dword ptr [ebp-4]
00401457 e8f3feffff call debug3!function1 (0040134f)
0040145c 83c40c add esp,0Ch
0040145f ff3548c14000 push dword ptr [debug3!_translation+0x23f (0040c148)]
00401465 e81e790000 call debug3!fprintfv+0x19a (00408d88)
0040146a 83c404 add esp,4
0040146d 68fbb24000 push offset debug3!_internalDigitArray+0x2263 (0040b2fb)
00401472 e8b1760000 call debug3!printf (00408b28)
00401477 83c404 add esp,4
0040147a 8dbd28ffffff lea edi,[ebp-0D8h]
00401480 57 push edi
00401481 68f8b24000 push offset debug3!_internalDigitArray+0x2260 (0040b2f8)
00401486 e8af430000 call debug3!scanf (0040583a)
0040148b 83c408 add esp,8
0040148e b800000000 mov eax,0
00401493 5f pop edi
00401494 5e pop esi
00401495 c9 leave
00401496 c3 ret

It is amazing! We have also proved that function1 was called with three arguments at main function.

Again, repeating the technique:

0:000> kb
ChildEBP RetAddr   Args to Child
0012fd88 004013c3  00000004 00000005 00000006 debug3!function2+0x3
0012fe7c 0040145c  00000001 00000002 00000003 debug3!function1+0x74
0012ff70 004012bc  00000001 00144380 001437e8 debug3!main+0x5e
0012ffc0 7c817067  00bcf6ee 00bcf754 7ffde000 debug3+0x12bc
0012fff0 00000000  00401225 00000000 78746341 kernel32!BaseProcessStart+0x23

0:000> uf 004012bc – 0x12bc
Flow analysis was incomplete, some code may be missing
debug3:
00400000 4d dec ebp
00400001 5a pop edx
00400002 90 nop
00400003 0003 add byte ptr [ebx],al
00400005 0000 add byte ptr [eax],al
00400007 000400 add byte ptr [eax+eax],al
0040000a 0000 add byte ptr [eax],al

Surprise! Our technique has failed! However, we can improvise by doing an educated guess (I’ve chosen 20 bytes, but I would have continued trying until finding the right point):

0:000> uf 004012bc – 20
debug3+0x129c:
0040129c 02ff add bh,bh
0040129e d1ff sar edi,1
004012a0 3530b04000 xor eax,offset debug3!_internalDigitArray+0x1f98 (0040b030)
004012a5 ff352cb04000 push dword ptr [debug3!_internalDigitArray+0x1f94 (0040b02c)]
004012ab ff3528b04000 push dword ptr [debug3!_internalDigitArray+0x1f90 (0040b028)]
004012b1 892514b04000 mov dword ptr [debug3!_internalDigitArray+0x1f7c (0040b014)],esp
004012b7 e842010000 call debug3!main (004013fe)
004012bc 83c418 add esp,18h
004012bf 31c9 xor ecx,ecx
004012c1 894dfc mov dword ptr [ebp-4],ecx
004012c4 50 push eax
004012c5 e8a67a0000 call debug3!fprintfv+0x182 (00408d70)
004012ca c9 leave
004012cb c3 ret

Another surprise: the main function does not have any argument, so those arguments that we have seen in the output from kb command are fake!

Finally, if the reader wants to examine all calls from any function, he/she can execute the following command (uf /c function):

0:000> uf /c main
debug3!main (004013fe)
debug3!main+0x48 (00401446):
call to debug3!printf (00408b28)
debug3!main+0x59 (00401457):
call to debug3!function1 (0040134f)
debug3!main+0x67 (00401465):
call to debug3!fprintfv+0x19a (00408d88)
debug3!main+0x74 (00401472):
call to debug3!printf (00408b28)
debug3!main+0x88 (00401486):
call to debug3!scanf (0040583a)

Once again, this article has explained how to examine the stack on a perfect case where nothing is corrupted. Obviously, the same fundamentals could be used during analysis of a corrupted stack. If I have enough time, I will release a new post about these interesting cases. Stay tuned!

Please, let me know whether you have liked this trivial article.

I hope you have a nice day.

Alexandre Borges.

(LinkedIn: http://www.linkedin.com/in/aleborges and Twitter: @ale_sp_brazil).

H2HC 2016 University – SLIDES

Dear friends…happy new year! After receiving so many requests, both slides from my presentations in Hacker to Hackers Conference (H2HC) 2016 University follow:

Few Tricks Used by Malwares: https://alexandreborgesbrazil.files.wordpress.com/2017/01/h2hc_university_talk_1_2016_r.pdf

Few Malware Anti-Forensics Techniques: https://alexandreborgesbrazil.files.wordpress.com/2017/01/h2hc_university_talk_2_2016-_r.pdf

Respective photos follow:

https://alexandreborges.org/2016/10/23/h2hc-2016-day-1/

https://alexandreborges.org/2016/10/24/h2hc-day-2/

In fact, both presentations were extremely basic (it is almost impossible to be simpler than these ones) and targeted on professionals who are beginning in this amazing area.

Honestly, I hope both slides sets can encourage you to learn more about Reverse Engineering and Malwares.

!gnisreveR raeY weN yppaH (Happy New Year Reversing!)

Alexandre Borges.

(LinkedIn: http://www.linkedin.com/in/aleborges and Twitter: @ale_sp_brazil)

PS: if it is possible, let me know you impression about both presentations. 🙂

Lecture about Malware Analysis at Unimonte university

Dear readers, good day. Last OCT/25 I taught a lecture about Malware Analysis at Unimonte university. As usual, all students (and teachers!) very interested in learning this fascinating world from IT security. Photos follow:


I hope you have a nice day.

Alexandre Borges

(LinkedIn: http://www.linkedin.com/in/aleborges and Twitter: @ale_sp_brazil)

H2HC 2016 – Day 2

Dear readers, what have you been doing? Yesterday, OCT/23, it happened the second day of the amazing Hacker to Hackers Conference (H2HC).

I had the opportunity of teaching a quick talk about Memory Analysis and a lecture about Malware Anti-Forensics. My attendees were amazing, very interested and we have a great moment. Few photos follow below:

I am extremely proud of taking part and, as I’ve already told previously, the H2HC is my second home.

I hope I see you next year!

Alexandre Borges

(LinkedIn: http://www.linkedin.com/in/aleborges and Twitter: @ale_sp_brazil)

Meeting Alex Mastrosov during H2HC

Dear readers, yesterday (Saturday, OCT/22) I had the opportunity to meet one of the greatest malware researches around the world: Alex Mastrosov. He is an amazing, excellent and humble person. Few photos with Alex follow below:

Really, I have an outstanding time during my short conversation with him. Thank you for the attention so much, Alex.

Have a nice day.

Alexandre Borges

(http://www.linkedin.com/in/aleborges and Twitter: @ale_sp_brazil)

H2HC 2016 – Day 1

Dear readers, how are you? Finally, yesterday the Hacker to Hackers 2016 started and, doubtless, it is my favorite event! During the first day, there were several amazing talks. Personally, I taught about “Malwares – Few tricks” during an one-hour talk. Few photos follow below:

During the day 2, I am talking during a workshop about Volatility (and other stuffs) and I am teaching another lecture about Malware Anti-Forensics techniques. Stay tuned!

Have a nice day.

Alexandre Borges.

(LinkedIn: http://www.linkedin.com/in/aleborges and Twitter: @ale_sp_brazil)

Lecture about Malware Analysis at UniSantos University

Hi readers..how are you? Last week, in OCT/18, I taught a lecture about Malware Analysis in the UniSantos University. We have a good time during the talk. Few photos follow:

The experience was great and I hope I have helped few students encouraging them to study about malwares.

Have a nice day.

Alexandre Borges

(LinkedIn: http://www.linkedin.com/in/aleborges and Twitter: @ale_sp_brazil)

Demystifying the Kerberos

Dear readers, how are you?

It is usual reading no such good words on the complex and hard understanding of the Kerberos. Although my area is Malware Analysis, Reverse Engineering and Software Exploitation, I’ve written two articles for Oracle trying to mitigate this undesirable impression about the Kerberos. I used Oracle Linux 7.2 for implementing the solution.

The first article deeply explains Kerberos concepts and showss how to implementing it. At end, I show how to integrate SSH with it.

The second article has a more practical approach. It explain how to implement an IdM (Identity Manager Server), integrating the Kerberos with Active Directory and Samba.

Both parts follow:

part 1: Kerberos concepts + implementation + SSH (32 pages): https://community.oracle.com/docs/DOC-1004909

part 2: Kerberos + IdM + Active Directory + Samba (44 pages): https://community.oracle.com/docs/DOC-1004910

In my opinion, Kerberos is an outstanding protocol and framework, and I hope this my small contribution to community helps professionals to see it from a different point of view.

Have a nice day.

Alexandre Borges

(LinkedIn: http://www.linkedin.com/in/aleborges and Twitter: @ale_sp_brazil)

Lecture about Malware Analysis at PUCC (Pontifícia Universidade Católica de Campinas)

Dear readers, what have you been doing? Last Thursday (SEP/15) I taught a lecture about Malware Analysis at PUCC. Few photos follow below:

Honestly, it was a great talk because students were very interested in learning and they made several amazing questions. Furthermore, PUCC is the university  where  I graduated, so it is special for me.

I hope you have a nice day. See you soon.

Alexandre Borges.

(LinkedIn: http://www.linkedin.com/in/aleborges and twitter: @ale_sp_brazil)

Lecture about Malware Analysis at USCS (Universidade São Caetano do Sul)

Dear readers, how are you? Few photos about my lecture on Malware Analysis at USCS follow:

I hope students continue studying and interested in learning about the most fascinating IT Security area that is Malware Analysis.

Have a nice day and see you soon.

Alexandre Borges

(LinkedIn: http://www.linkedin.com/in/aleborges and twitter: @ale_sp_brazil)

Administering Oracle Linux 7.2: Part 1 — Configuring a Time Server and Kerberos

Hello readers, how are you? It follows the first part of a series about Kerberos in Oracle Linux 7.x:

https://community.oracle.com/docs/DOC-1004909

This is a long article about an usually complex stuff. I hope you like it.

Have a nice day.

Alexandre Borges

(LinkedIn: http://www.linkedin.com/in/aleborges and twitter: @ale_sp_brazil)

GUOB Tech Day 2016 – Hunting Malware in the memory on Oracle Linux 7.x

Dear readers, how are you? In July/30 I’ve taught the lecture “Hunting Malwares in the Memory on Oracle Linux 7.x” at GUOB Tech Day 2016 – Latin America OTN tour. It was a wonderful event and very well organized (http://www.guobtechday2016.eventize.com.br/index.php?pagina=3). 

My talk was a very introductory lecture about malware infection on Linux systems with duration of 45 minutes. I was surprised because, though most audience were DBAs (therefore, they are not deeply involved with the security area), they were interested in learning this topic and we enjoyed so much. Honestly, it is easy talking to experienced professionals.

Few photos follow:

Other nice pictures can be found on Carina Mendes’s website: http://carinamendes.us10.list-manage.com/track/click?u=e7e074f7bcc92f08502f6fcb9&id=e33e684fa8&e=22f0730503 

I hope you have a nice day.

Alexandre Borges.

(LinkedIn: http://www.linkedin.com/in/aleborges and Twitter: @ale_sp_brazil).

Oracle Open World Latin America 2016 – Hunting malwares in the memory in the Oracle Linux 7.x

Dear readers, how are you? Last week I spoke about “Hunting malwares in the memory in the Oracle Linux 7.x” at Oracle Open World 2016 Latin America. Few photos from my session follow:

Personally, I liked this event so much because there were many interested people in learning and discovering how it is possible to detect an infection on the memory in the Oracle Linux 7.x.

I haven’t decided it yet, but eventually I will put slides out. Stay tuned!

Have a nice day.

Alexandre Borges

(LinkedIn: http://www.linkedin.com/in/aleborges and twitter: @ale_sp_brazil)

BSIDES LATAM 2016 – Hunting Malwares on the Memory

Dear readers, how are you? Yesterday, June/12, I taught a lecture titled “Hunting malwares on the memory” in BSIDES Latin America 2016. It follows few photos:

I am proud of having taken part of the first BSIDES LATAM 2016 for three reasons:

  1. Attendees from my lectures were amazing. They were smart, very interested and made good questions.
  2. Ponai Rocha (one of the organizers) was very polite and an outstanding host.
  3. BSIDES LATAM is a technical event with few vendors and quite really interesting lectures taught by experts.

Honestly, I hope my attendees have learned and gotten motivated to study a bit more about Malware and Memory Analysis.

I hope you have a nice day.

Alexandre Borges.

(LinkedIn: http://www.linkedin.com/in/aleborges and twitter: @ale_sp_brazil)

Lecture about Malware and Memory Forensics Analsysis at UniSanta University

Dear readers, how are you? Yesterday (MAY/18), I taught a new lecture about Malware and Memory Analysis at UniSanta University. Few photos follow below:

It was a fantastic lecture where I could show a deeper memory forensic analysis than I did in other talks.

I hope you have a nice day.

Alexandre Borges

(Linkedin: http://www.linkedin.com/in/aleborges and twitter: @ale_sp_brazil)

Lecture about Malware and Memory Analysis at UNASP University

Dear readers, how are you? Yesterday, MAY/17, I taught a lecture about Malware and Memory Analysis at UNASP university. Follow few photos:

Honestly, I really had a very good time. Teachers and students were very polite and the auditorium was very organized.

I hope you are fine and have a nice day.

Alexandre Borges

(LinkedIn://www.linkedin.com/in/aleborges and twitter: @ale_sp_brazil)

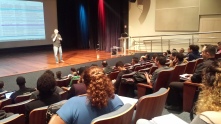
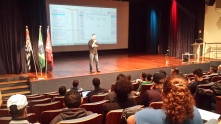
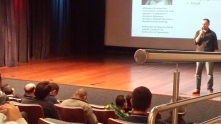
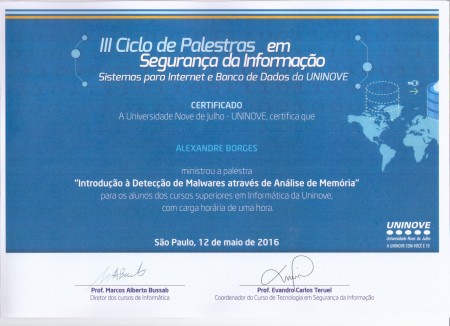
Lecture about Introduction to Malware Detection through Memory Analysis at UniNove University

Dear friends, how are you? Yesterday (MAY/12), I taught a lecture about Introduction to Malware Detection through Memory Analysis at UniNove University. Few photos follow below:

Additionally, it follows my certificate:

UniNove_Cert

I hope you have a nice day.

Alexandre Borges

(LinkedIn:http://www.linkedin.com/in/aleborges and twitter: @ale_sp_brazil)

Lecture about Malware and Memory Forensic Analyis to FMU University

Dear readers, how are you? Last Thursday (MAY/05), I was teaching a lecture about Malware and Memory Analysis at FMU University. Few photos follow:

I hope I am able to continue motivating students to learn and work on this fascinating area.

Have a nice day.

Alexandre Borges

(LinkedIn: http://www.linkedin.com/in/aleborges and twitter: @ale_sp_brazil)

Lecture about Malware and Memory Analysis at PUC-SP University

Hi readers, how are you? Continuing my journey in universities, last Thursday (MAY/05) I was teaching a lecture about Malware and Memory Analysis at PUC-SP university. Few photos follow:

I keep my work in teaching lectures about Malware and Memory Analysis at universities because I really believe that it is possible to find top minds there and present concepts about Malware Analysis world to students for making their career better and motivating.

Have a nice day.

Alexandre Borges.

(LinkedIn: http://www.linkedin.com/in/aleborges and twitter: @ale_sp_brazil).

Lecture about Malware and Memory Analysis at UNASP-EC

Dear reader, what have you been doing? Yesterday I taught a lecture about Malware and Memory Analysis at UNASP-EC University. Few photos follow:

I keep my work trying to bring real, practical and interesting concepts for students at different universities who would never learn it. Honestly, it’s my contribution to society and I hope I can motivate these students to study these topics such as malware and memory analysis and work hard enough to make real progress in their career.

Have a nice day.

Alexandre Borges

(LinkedIn – http://www.linkedin.com/in/aleborges and twitter: @ale_sp_brazil)

Lecture about Malware and Memory Analysis at ITA

Dear readers, how are you? Yesterday I taught a lecture about Malware and Memory Analysis at ITA (Instituto Tecnológico da Aeronáutica – Technological Institute of Aeronautics). Few photos follow:

This is the letter certifying my talk:

ITA_Cert


I hope you have a nice day.

Alexandre Borges.

(LinkedIn: http://www.linkedin.com/in/aleborges and twitter:@ale_sp_brazil)

Lecture about Malware and Memory Analysis at Unimonte University

How are you, readers? Last Tuesday (APRIL/19/2016) I taught a lecture about “Malware and Memory Analysis” at Unimonte University in Santos. Honestly, I had a great time because students were very interested and teachers were very polite. Few photos follow:

IMG-20160420-WA0012 IMG-20160420-WA0013 IMG-20160420-WA0014 IMG-20160420-WA0015 IMG-20160420-WA0016 IMG-20160420-WA0017 IMG-20160420-WA0018 IMG-20160420-WA0019 IMG-20160420-WA0021 IMG-20160420-WA0022 IMG-20160420-WA0023 IMG-20160420-WA0024 IMG-20160420-WA0025 IMG-20160420-WA0027 IMG-20160420-WA0030 IMG-20160420-WA0031 IMG-20160420-WA0033 IMG-20160420-WA0034 IMG-20160420-WA0035

And my certificate (Brazilian language):

Unimonte_Certificate

Furthermore, I met several smart students and made new friends.

I hope you have a nice day.

Alexandre Borges

(LinkedIn: http://www.linkedin.com/in/aleborges and twitter: @ale_sp_brazil)

ISC2/Kafinet Information Security Trends 2016 event

Readers, how you are? Last Tuesday (APR/19/2016) I spoken at (ISC)2 / Kafinet Information Security Trends 2016 about “Malwares: the worst threat”. Few photos follow:

IMG-20160420-WA0000 IMG-20160420-WA0007 IMG-20160420-WA0008 IMG-20160420-WA0010

It was an interesting event where few key IT professionals attended talks from specialists such as Anderson Dadario and Edson Borelli.

Have a nice day.

Alexandre Borges.

(LinkedIn: http://www.linkedin.com/in/aleborges and twitter: @ale_sp_brazil)

Lecture at UnG – Introduction to Malware Analysis

Dear readers, how are you?

Yesterday (APRIL/07/2016), I spoke at UnG (Universidade de Guarulhos – Guarulhos University) about Introduction to Malware Analysis. Honestly, I had a great time with many students and teachers attending the lecture. It follows the certificate which I earned from the UnG:

Once more, thank you to everybody from UnG for the generosity and kindness during my lecture.

I hope you have a nice day.

Alexandre Borges

(LinkedIn: http://www.linkedin.com/in/aleborges) and twitter: @ale_sp_brazil .

Reversing: few words about a trivial code

(this short write up can be read in pdf format: https://alexandreborgesbrazil.files.wordpress.com/2016/01/reversing_few_words_about_a_trivial-code2.pdf)

Dear readers, how are you? During my classes and presentations, it is extremely common to hear students and professionals comparing different areas inside IT security, but honestly I think is neither possible nor feasible to do this “mental exercise”. Yesterday, I received one of this kind of message and, in the middle of the e-mail, I could read that “doubtless, hacking (pentest) is more difficult than reverse engineering and malware analysis”. I am not sure if it’s possible to state it. As an super easy educative example, I sent this code (I cleaned it a bit to make it clearer) below to my student and I asked him about two things: a) What’s the equivalent structure in C that the code is representing? b) How does it work?

.text:004028BC mov [ebp+var_C], eax

.text:004028BF mov ecx, [ebp+var_10]

.text:004028C2 movsx edx, byte ptr [ecx]

.text:004028C5 mov [ebp+var_14], edx

.text:004028C8 mov eax, [ebp+var_14]

.text:004028CB sub eax, 64h

.text:004028CE mov [ebp+var_14], eax

.text:004028D1 cmp [ebp+var_14], 0Fh ;

.text:004028D5 ja short loc_402923 ;

.text:004028D7 mov edx, [ebp+var_14]

.text:004028DA xor ecx, ecx

.text:004028DC mov cl, ds:byte_40293E[edx]

.text:004028E2 jmp ds:off_40292A[ecx*4] ; switch jump

.text:004028E9 ; —————————————————————————

.text:004028E9 loc_4028E9:

.text:004028E9        ; CODE XREF: sub_402884+5Ej

.text:004028E9 ; DATA XREF: .text:off_40292Ao

.text:004028E9 mov eax, [ebp+var_C] ;

.text:004028EC push eax ; char *

.text:004028ED call sub_401565

.text:004028F2 add esp, 4

.text:004028F5 jmp short loc_402923

.text:004028F7 ; —————————————————————————

.text:004028F7 loc_4028F7:

.text:004028F7         ; CODE XREF: sub_402884+5Ej

.text:004028F7 ; DATA XREF: .text:off_40292Ao

.text:004028F7 mov [ebp+var_4], 1 ;

.text:004028FE jmp short loc_402923 ;

.text:00402900 ; —————————————————————————

.text:00402900 loc_402900:

.text:00402900         ; CODE XREF: sub_402884+5Ej

.text:00402900        

.text:00402900 mov ecx, [ebp+var_C] ;

.text:00402903 push ecx ; char *

.text:00402904 call sub_402813

.text:00402909 add esp, 4

.text:0040290C jmp short loc_402923 ;

.text:0040290E ; —————————————————————————

.text:0040290E

.text:0040290E loc_40290E:

.text:0040290E

.text:0040290E mov edx, [ebp+var_C] ;

.text:00402911 push edx ; char *

.text:00402912 call sub_402851

.text:00402929 add esp, 4

.text:0040291A mov eax, [ebp+arg_4]

.text:0040291D mov dword ptr [eax], 1

.text:00402923

.text:00402923 loc_402923:

.text:00402923

.text:00402923 mov eax, [ebp+var_4] ; jumptable 004028E2 default case

.text:00402926 mov esp, ebp

.text:00402928 pop ebp

.text:00402929 retn

.text:00402929 sub_402884 endp

.text:00402929

.text:00402929 ; —————————————————————————

.text:0040292A        dd offset loc_4028E9 ; DATA XREF: sub_402884+5Er

.text:0040292A        dd offset loc_4028F7 ; jump table for switch statement

.text:0040292A        dd offset loc_40290E

.text:0040292A        dd offset loc_402900

.text:0040292A         dd offset loc_402923

.text:0040293E        db 0, 4, 4, 4 ; DATA XREF: sub_402884+58r

.text:0040293E        db 4, 4, 4, 4 ; indirect table for switch statement

.text:0040293E        db 4, 4, 1, 4

.text:0040293E        db 4, 4, 2, 3

.text:0040294E


As I stated previously, the code above is trivial and, in a nutshell, although this code have been extracted from a malware, there is only reverse engineering here. Few comments follow:

  • The represented structure is a simple “switch case” statement (it is easily identified by IDA Pro).
  • There’re 16 possible cases (you should pay attention in the comparison at 0x004028D1 and remember that 0x0F is equal to 16).
  • The variable which is defining the cases is var_16 (look at 0x004028D7). It is will be loaded to edx and it will be acting as an index (more details below).
  • A jump table (0x0040292A) is being used to represent the switch case statements.
  • Looking at the jump table pointers (0x0040293E), we notice that there’re only five different indexes (0 to 4), so we have only five different statements in a nutshell. Therefore, the instruction mov cl, ds:byte_40293E[edx] (at 0x004028DC) servers as an index to jump table pointers. Depending on this index (0 to 15 – you remember that there are 16 possible cases in this example), the program chooses a pointer. For example, if the index is A(0x10) then the index in the jump table pointer is “1” (check this information by counting the values at 0x0040293E lines). Looking at jump table(0x0040292A), the second switch statement (remember, the range is from 0 to 4) is the address 0x004028F7
    (dd offset loc_4028F7).
  • Thus, the “switch jump” instruction jmp ds:off_40292A[ecx*4] at address 0x004028E2 finally jumps the code flow to the mentioned address above (0x004028F7).

As I said previously, this is an super easy and basic construction, but most time while I am analyzing malwares I see pieces of code like that. In fact, it is suitable to tell that malware analysis is much more difficult than a simple switch case statement. Sure, I could explain several kind of hooking, injections, hijacking , and so on, but I chose this example to prove to my student that is not possible to compare different areas before having a better knowledge about both them (in time: my student wasn’t able to answer my questions at beginning of this write up).

Personally, my life is IT Security and I have a strong preference by malware analysis, so I am available to help you when necessary. If you want, I will be teaching few courses this year (more at http://alexandreborges.org/my-courses/) and I hope see you there.

Have a nice day.

Alexandre Borges.

(LinkedIn: http://www.linkedin.com/in/aleborges and twitter: @ale_sp_brazil).

Oracle 12c Transportable Tablespace on OTN (Oracle Technology Network)

Dear readers, how are you? It follows my article about Oracle 12c Transportable Tablespace on OTN (Oracle Technology Network):

https://community.oracle.com/docs/DOC-922240

I hope you have a nice day.

Alexandre Borges.

(LinkedIn: http://www.linkedin.com/in/aleborges and Twitter: @ale_sp_brazil)

Speaking about IT Security at UNISA

Dear readers, what have you been doing? Continuing my project of talking about IT Security in universities, it follows below the certificate that I earned for my speak at UNISA:

Once more, I am available to talk about IT Security (Hacking, Malware Detection, Malware Analysis, Digital Forensics and Software Exploitation) in universities and companies without charging any fee. If you are interested, send me an e-mail to alexandreborges [at] alexandreborges [dot] org.

I hope you have a nice week.

Alexandre Borges.

(LinkedIn: http://www.linkedin.com/in/aleborges and Twitter: @ale_sp_brazil).

Speaking about security aspects in the Software Engineering at PUC University

Dear readers, how are you? Few weeks ago, I spoke about “Security Aspects in the Software Engineering” to excellent postgraduate students from Software Engineering course at PUC (Pontifícia Universidade Católica) University in Sao Paulo. It follows my certificate:

I keep my mission which is to talk about modern security topics to universities and companies without charging anything. If you are interested, send me an e-mail: alexandreborges [at] alexandreborges [dot] org.

Have a nice day.

Alexandre Borges.

(LinkedIn: http://www.linkedin.com/in/aleborges and Twitter: @ale_sp_brazil)

Speaking at Security Congress Latin America 2015

Dear friends, how are you? Today I spoke about Memory Forensic Analysis in the Security Congress Latin America 2015 (#isc2congresslatam). Fortunately, I had a great audience who were attending my speak:

This year, I have been focusing on speaking about malwares detection by using Memory Analysis. Next year, I will focus on a harder topic: Malware Analysis. Most people believe that’s accessible topic. They are wrong. Certainly, it’s the most difficult and brutal topic in IT Security area. Stay tunned!

I hope you have a nice day.

Alexandre Borges.

(LinkedIn: http://www.linkedin.com/in/aleborges and twitter: @ale_sp_brazil).

Administering Oracle Linux 7: Part 3 – The systemd journal

Dear readers, how are you? It follows the third part of my series about Oracle Linux 7 on GPO (Oracle Professional Group):

http://www.profissionaloracle.com.br/gpo/artigo/sistema-operacional/528-administering-oracle-linux-7-part-3-the-systemd-journal

I hope you enjoy it. Have a nice day.

Alexandre Borges

(LinkedIn: http://www.linkedin.com/in/aleborges and Twitter: @ale_sp_brazil)

Administering Oracle Linux 7: Part 2 – Network Management

Dear readers, I hope you are fine! It follows my second article (always in English, sure) about Oracle Linux 7 on GPO (Oracle Professional Group):

http://www.profissionaloracle.com.br/gpo/artigo/sistema-operacional/526-administering-oracle-linux-7-part-2-network-management

Personally, I recommend signing the GPO mailing list because there are many articles from excellent authors. More information on: http://www.profissionaloracle.com.br/gpo/ (this is a Portuguese website).

Have a nice day.

Alexandre Borges

(LinkedIn: http://www.linkedin.com/in/aleborges and Twitter: @ale_sp_brazil)

Administering Oracle Linux 7: Part 1—Service Management

Hello readers, how are you? This week I became an author on GPO (Grupo de Profissionais Oracle, in Portuguese) / OPG (Oracle Professional Group) site, where I’ll be publishing some articles about Oracle technologies. The first one (in English) about Oracle Linux 7 was published today:

http://www.profissionaloracle.com.br/gpo/artigo/sistema-operacional/525-administering-oracle-linux-7-part-1-service-management

I hope you enjoy the article.

Have a nice day.

Alexandre Borges

(LinkedIn: http://www.linkedin.com/in/aleborges — Twitter: @ale_sp_brazil)

Hacker to Hackers Conference (H2HC) University 2015

Dear readers, how are you? Yesterday (OCT/24/2015), I spoke about “Memory and Malware Analysis” at Hacker to Hackers Conference (H2HC) University in Sao Paulo. All attendees were great, they interacted so much and asked very interesting questions. Links for H2HC University follow:

https://www.h2hc.com.br/university/

https://www.h2hc.com.br/h2hc/pt/agenda

I would like to thank you Rodrigo Branco and Filipe Balestra by the invite to speak at biggest hacker conference in the Latin America.

Additionally, in special, I would like to thank my friend Cleiton Alves for his help during all time. Sincerely, thank you so much.

Have a nice day.

Alexandre Borges.

(Linkedin: http://www.linkedin.com/in/aleborges)

Introduction to Malware Detection at BandTec

Dear readers, how are you? Yesterday night (OCT/24/2015), I spoke about “Introduction to Malware Detection” for students at VI TechWeek at Faculdade deTecnologia Bandeirantes (BandTec) in Sao Paulo:

I want to thank to the teachers Carlos Gimenes, Bianka Gonçalves and Sandro Melo for having given me the opportunity to talk to their students.

Honestly, I hope I can have contributed for improving the student’s knowledge.

Have a nice day.

Alexandre Borges

(LinkedIn: http://www.linkedin.com/in/aleborges)

Windows Malware and Memory Forensic Training with Volatility Developers

Hello readers, how are you? This week I am attending the Windows Malware and Memory Forensics
Training with Volatility developers (Michael Ligh, Jamie Levy and Andrew Case) in Reston (Virginia – USA). There is only one way to summary the course: PERFECT! It is extremely organized, includes theory and many practical exercises. Furthermore, all explanations are clear, concise and very informative. Another bonus is that all exercises come with well-explained answers.

Is it all? No, it is not. The volatility developers know everything about Windows Internals, Malware and Digital Forensics. Personally, Michael Ligh is the one of two most impressive and smarter guys who I know (the another one is Michael Sikorski) and Jamie Levy is, certainly, the most intelligent girl (by far). Furthermore, Michael and Jamie are very humble, polite and lovely humans being. Certainly, it is only possible to talk good words about them.

Some pictures follow below:

Figure 1:
Michael Ligh (one of two more outstanding and intelligent professionals that I have ever met in my life) and I

Figure 2: Jamie Levy (the most intelligent girl of the world and a very lovely person) and I

Figure 3: Andrew Case and I during a happy hour

Honestly, I am having a perfect course during a perfect week.

I hope you have a nice day.

Alexandre Borges.

(LinkedIn: http://www.linkedin.com/in/aleborges)

Meeting Michael Sikorski in NYC (SEP/2015)

Dear readers, how are you? Today I have an amazing and unforgettable day lunching with Michael Sikorski in NYC. For people who do not know Michael, he is author of Practical Malware Analysis book and director of FLARE (FireEye Labs Advanced Reverse Engineering) at FireEye. Certainly I can tell you that Michael is very polite, friendly, an extremely humble person and so different from other professionals who I know that do not have (even close) the same knowledge.There are not enough good words to praise Michael. Follow below a picture with Michael in a restaurant:

I’ve been learning with top minds such as Michael Sikorski for being able to share the knowledge. Honestly, I hope I am successful.

In this world, we meet few relevant and remarkable people. Michael is one of them.

Have a nice day.

Alexandre Borges.

(LinkedIn: http://www.linkedin.com/in/aleborges)

DerbyCon 2015 – first update

Dear readers, how are you? This is a quick post about the fantastic DerbyCon 2015 in Louisville / Kentucky (USA). I have attendend the outstanding Corelan Advanced Software Exploitation course with Peter van Eeckhoutte (corelanc0d3r). Some draft pictures follow below:

Figure 1: Peter van Eeckhoutte (Corelan) and I in DerbyCon 2015

Figure 2: DerbyCon 2015 flag

Figure 3: DerbyCon 2015 badge

Figure 4: HD Moore (Metasploit creator) and I in DerbyCon 2015

Have a nice day and soon I’ll post news about DerbyCon 2015

Alexandre Borges

(LinkedIn: http://www.linkedin.com/in/aleborges)

Speaking at “FATEC Baixada Santista”

Dear readers, how are you? Yesterday I spoke about “IT Security: challenges and best practices” at Fatec Baixada Santista (Santos/SP). Honestly, I enjoyed each minute there by helping all students to understand a bit more about security. Furthermore, I would like to thank teachers Eliana Rodrigues, Rosana Cammarosano and Marco Simões. It follows below the certificate that I earned. Certainly, I am glad and very proud for it:

If you want I speak at your university or company about Malware, Forensic Analysis, Sofware Exploitation, Hacking and Memory Forensic Analysis, send me an e-mail to alexandreborges [at] alexandreborges [dot] com. It is a pro-bono (volunteering) work.

I hope you have a nice.

Alexandre Borges

(LinkedIn: http://www.linkedin.com/in/aleborges)

Speaking about Hacking, Malware and Career at FATEC

Dear readers, what have you been doing? I am speaking about Information Security on SEP/12 at FATEC Rubens Lara, in Santos/SP. Honestly, I am honored by opportunity to help and incentivate students to track this interesting area. The topics which I am speaking are:

  • Hacking Attacks
  • Malwares and Best Practices
  • Certification and Career

I want to thank teachers Marco Simões, Eliana Rodrigues and Rosemeire Vidal by the invitation.

Have a nice day.

Alexandre Borges

(LinkedIn: http://www.linkedin.com/in/aleborges)

MindTheSec 2015 Forum Brazil – GPU Malware presentation

Dear readers, how are you? It follows the slides of my simple presentation on MindTheSec 2015 Forum Brazil (http://mindthesec.com.br/alexandre-borges) about GPU Malwares:

https://alexandreborgesbrazil.files.wordpress.com/2015/09/2015-mindthesec-alexandre_borges1.pdf

Enjoy it!

I hope you have a nice day and feel free to comment about the slides.

Alexandre Borges

(LinkedIn: http://www.linkedin.com/in/aleborges)

Windows: Dispatching and Scheduling (a short explanation)

Last week a student asked about the correct difference between Dispatching and Scheduling on Windows systems. Of course, this a long topic to talk and write, mainly when the time is very tight, but I will try to summarize the topic below.

Fundamentally, Dispatching is the the process (or action) of switching from a thread executing to another one, while Scheduling is the action of determining the next thread to be executed on the processor. Additionally, there are typical and main states for a thread such as Wait (blocked, waiting any related event occurs), Running (thread is active and running on CPU) and Ready (thread is eligible to run, but it needs to receive an authorization from OS for doing it). A thread can be in Waiting status because a system call (such as an execution of KeWaitSingleObject() by a device driver) and its state is controlled by KTHREAD structure (which is embedded inside the ETHREAD structure and holds information about thread stack, system calls, scheduling, priorities, and so on). A thread can be also in Running status that is determined by KPCR (Kernel Processor Control Region) structure (it can be accessed by functions such as KsGetCurrentThread() and PsGetCurrentProcess()) that holds information about the CPU (if the system has many CPUs, so there’re many KPCRs and each one holds CPU information that is shared by HAL and kernel). During a dispatching, the kernel saves the entire context from the current thread then it executes either the KiSwapThread() or KiSwitchToThread() for loading the context from the new thread.

How does the kernel choose the next thread to be activated and run? It uses the Scheduling feature to pick the next thread to run based on its priority given by Priority field (it can be changed by KeSetPriorityThread(), for example) from KPROCESS structure and respects the BasePriority attribute (the value can changed by using the KeSetBasePriorityThread()) that is the minimum value of Priority attribute. About priorities, there are two valid ranges such as “Dynamic Priority” (from 1 to 15) and “Real Time” (from 16 to 31), where the OS varies the thread’s priority of the former range, but it doesn’t vary the thread’s priority from the latter one. Therefore, real time thread can cause CPU starvation.

The Dynamic Priority value can be changed by operating system when events such as quantum exhaustion (the thread used its time slice), not running (not running threads gain a priority boots for having a chance to run), I/O completion (a driver has finished its I/O job and the current related thread needs of a chance to return to CPU) and KeSetEvent function that helps by bursting the the current thread’s priority to run on CPU.

Changing to a practical approach, examine the colors of the following WinDbg’s output:

lkd> !thread

THREAD fffff80002e58cc0 Cid 0000.0000 Teb: 0000000000000000 Win32Thread: 0000000000000000 RUNNING on processor 0
Not impersonating
DeviceMap fffff8a000008aa0
Owning Process fffff80002e59180 Image: Idle
Attached Process fffffa800a2e6b10 Image: System
Wait Start TickCount 430911 Ticks: 9 (0:00:00:00.140)
Context Switch Count 8568683
UserTime 00:00:00.000
KernelTime 01:45:09.008
Win32 Start Address nt!KiIdleLoop (0xfffff80002cc3570)
Stack Init fffff8000410adb0 Current fffff8000410ad40
Base fffff8000410b000 Limit fffff80004105000 Call 0
Priority 16 BasePriority 0 UnusualBoost 0 ForegroundBoost 0 IoPriority 0 PagePriority 0
Unable to get context for thread running on processor 0, HRESULT 0x80004001

lkd> !pcr

KPCR for Processor 0 at fffff80002e4ad00:

Major 1 Minor 1

    NtTib.ExceptionList: fffff80004103000
     NtTib.StackBase: fffff80004104080
     NtTib.StackLimit: 000000000020e448
     NtTib.SubSystemTib: fffff80002e4ad00
     NtTib.Version: 0000000002e4ae80
     NtTib.UserPointer: fffff80002e4b4f0
     NtTib.SelfTib: 000007fffff82000
     SelfPcr: 0000000000000000
     Prcb: fffff80002e4ae80
     Irql: 0000000000000000
     IRR: 0000000000000000
     IDR: 0000000000000000
     InterruptMode: 0000000000000000
     IDT: 0000000000000000
     GDT: 0000000000000000
     TSS: 0000000000000000
     CurrentThread: fffff80002e58cc0
     NextThread: 0000000000000000
     IdleThread: fffff80002e58cc0
     DpcQueue:

lkd> !ready

Processor 0: No threads in READY state
Processor 1: No threads in READY state
Processor 2: No threads in READY state
Processor 3: No threads in READY state
Processor 4: No threads in READY state
Processor 5: No threads in READY state
Processor 6: No threads in READY state
Processor 7: No threads in READY state

My system is completely idle, but you are able to realize the Current Thread, NextThread (none) and the IdleThread values from the output above. Unfortunately, the WinDbg shows the partial contents of the PCR by using !pcr command.

I know that’s a basic explanation (without digging into excessive details) , but it can helps when you are studying and leaning the internal structures of Windows.

Have a nice day.

Alexandre Borges

(LinkedIn: www.linkedin.com/in/aleborges)

Pivoting in Metaploit – Part 9 (Portuguese)

Hello people, what have you been up to ? It follows my new column in Linux Magazine Brazil. This time I explain about Metasploit pivoting:

http://tinyurl.com/l6dw63b

If you want to know more about this series of articles, I suggest reading this previous post:

http://alexandreborges.org/2014/02/24/linux-magazine-brazil-column-portuguese-language/

Have a nice day.

Alexandre Borges.

Metasploit (part 1 to 8) – Columns on Linux Magazine (portuguese language)

Hello everybody, how are you ? It follows the newest column (portuguese language) on Linux Magazine Brazil about Metaploit:

http://tinyurl.com/q6r7h27

Please, remember: there’re other parts from this simple tutorial:

(part 1): http://tinyurl.com/qzpzwdo

(part 2): http://tinyurl.com/l5hvpk5

(part 3): http://tinyurl.com/ko7cydf

(part 4): http://tinyurl.com/mhjnsrk

(part 5): http://tinyurl.com/mw98gu7

(part 6):http://tinyurl.com/mksjk5a

(part 7): http://tinyurl.com/lqhnssd

Have a nice day.

Alexandre Borges